Western Weather 2017-18 and Later

It sure did up here in the PNW. Most of the action obviously stayed south of us.
So far this is the most unusual feature of the 2022-23 ski season. The La Nina is still going strong though off its peak last summer. The Sierra and Utah have had huge seasons during La Nina before, notably in 2010-11.

During moderate to strong La Ninas, there has been no season under 102% in the PNW and no season under 96% in western Canada. As of end of January the PNW is at 86% and western Canada at 83%.
 
Breck and Loveland are not above average.
The surprise is Breck IMO. Surrounded by places at least at and slightly above average all around them and I cant recall them reporting particularly low snowfall from any of the storms.

Loveland OTOH has been nearly skunked from several storms for completely unknown reasons. eg both Eldora and ABasin/Keystone reporting decent snowfalls and Loveland only getting 1-2" on multiple occasions. It's been weird for them for sure this year...

Long range continues to show relatively dry weather for a good chunk of the month.
Crossing my fingers that the PNW/Canada starts to pick up later in the month. I have trip to Fernie/Castle in early March....🤞
 
Impressive pics from Tahoe and Mammoth the last week or so. Mammoth and Squaw get to July 4 this year even without any more snow?
 
Mammoth for sure. Squaw/Palisades is lower and also takes a beating from sun because the highest slopes face east. Consequently, even though Palisades is overall one of the great expert mountains anywhere, most of its lift served expert terrain is done by the end of May even in huge years. Even Siberia closed mid-June in 2017, leaving just north facing 700 vertical Shirley Lake for July 4. Some of the steeps at the top of Mammoth are skiable to closing as in August 2017.
 
I have a friend going to Mammoth for a 5 day stay starting on April 2. He was doing the standard snow fretting thing when you’re travelling a long distance for a snow trip. “It’s still 3 weeks away and they might not get any more snow”. I confidently told him there would be plenty to slide on. Would be great to see him get snowed on as I have the two times I’ve been to Mammoth in early April.
 
“It’s still 3 weeks away and they might not get any more snow”.
:rotfl::rotfl:
He might actually want that. How often has the entire mountain been open this season due to wind, visibility or avalanche risk? Mammoth is very similar to the Alps in that regard.
 
:rotfl::rotfl:
He might actually want that. How often has the entire mountain been open this season due to wind, visibility or avalanche risk? Mammoth is very similar to the Alps in that regard.
He and his partner have only ever skied at Mt Hotham in Victoria and a few days at Coronet Peak in NZ. They will get that same ‘blown away’ feeling that all Aussies get when skiing on a big mountain for the first time.
 
New Zealand has the same weather issues as Mammoth and the Alps, though Coronet is probably not as wind exposed as most NZ areas.
 
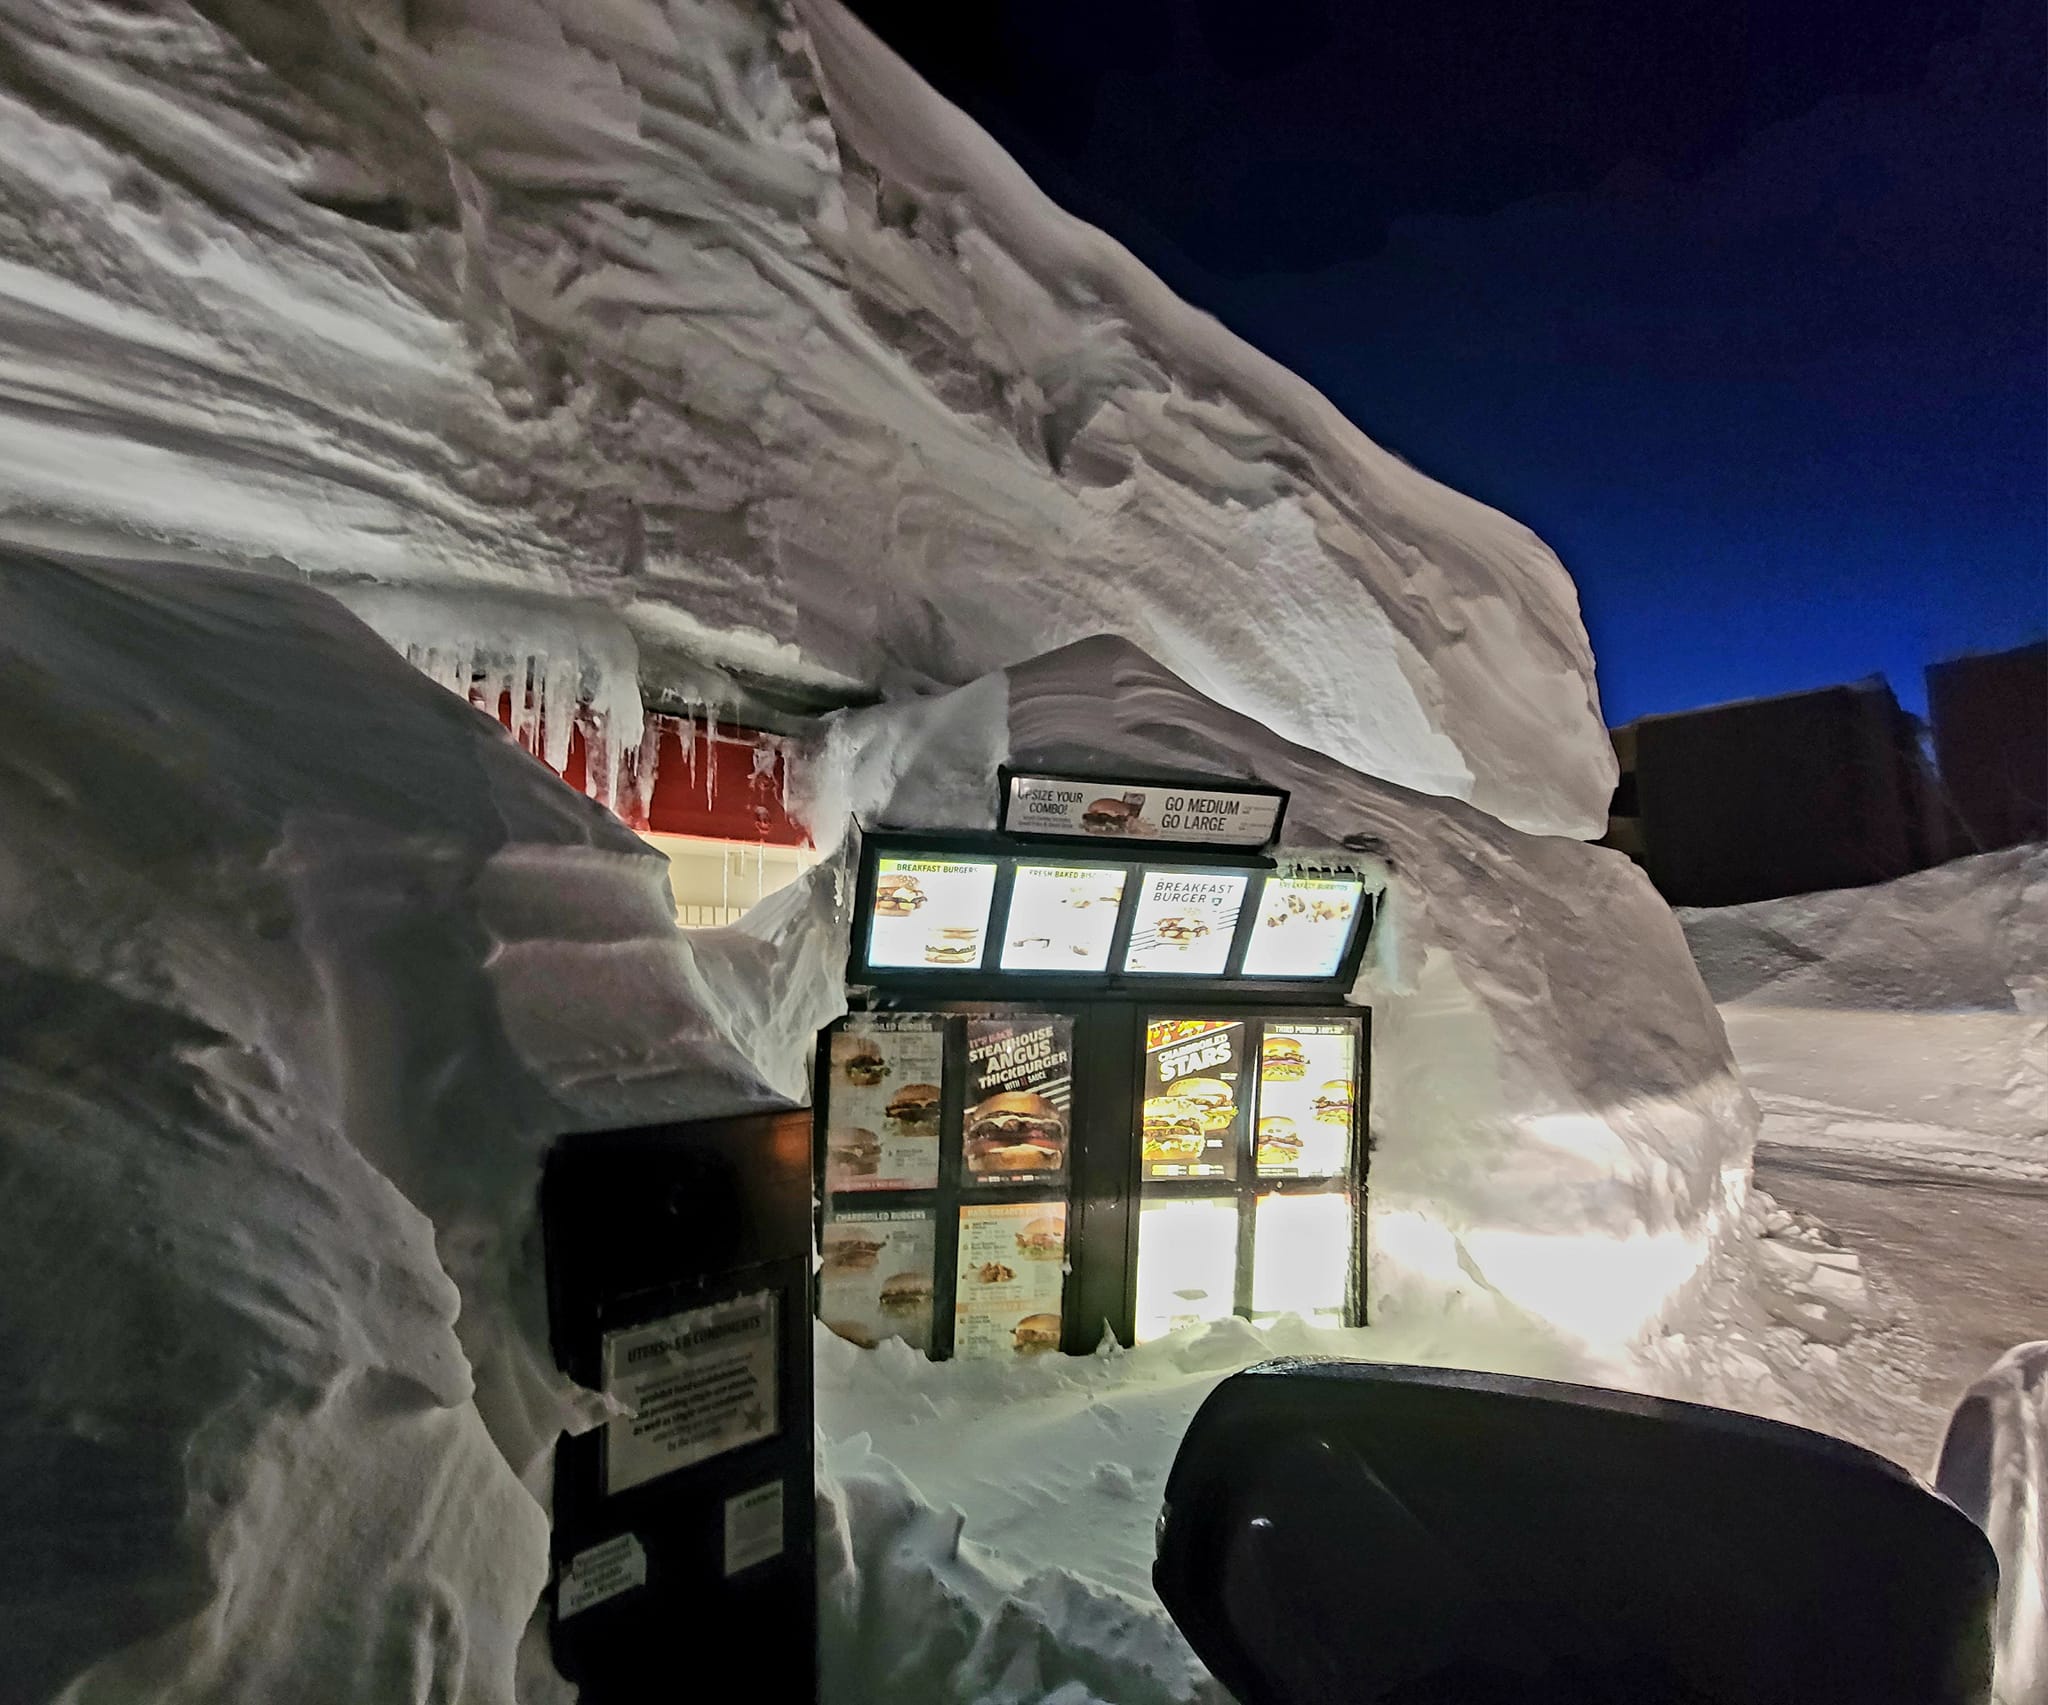
Mammoth fast food drive-thru

326222270_480039910775708_9053185288509953417_n.jpeg

326500810_840976756985867_2121923205227540087_n.jpg
 
OpenSnow says Mammoth will get another 52-68 inches over this weekend and 2-3 feet more by Tuesday. Season total will get comfortably over 600 inches, closing in on the record 652.5 inches in 2010-11.
 
Is your friend refusing to acknowledge photos like the ones posted above and in the Tahoe reports?
Relatively inexperienced skiers that have no exposure to snowfall sometimes don't understand that all the snow won't melt over the course of a couple of weeks.........
The concept that snow is very well naturally insulated took some time for me to come to grips with too.
 
Insane how deep the snow is to swallow Chair 1 at Mammoth.
Todays favorite Mammoth photo.
That's the pic in my most recent mid-month snow report on the FTO home page.

Overall North America is at 123% of normal, which would be 2nd to 2010-11 if it sustains that pace. California is at 198% and Utah at 171%. Lots of Utah Records should fall as the prior highest season was only 136%. California is less clear because the prior high was 171% and April snowfall tends to decline more sharply in April than in Utah.
 
Last edited:
Not too many days per year when avi danger get high or extreme in lots of Colo... But right now is one of those times, in part due to the big warm up mid last week followed by heavy snow on top...

March 22, 2023 Avi danger
Avi danger.JPG
 
Not too many days per year when avi danger get high or extreme in lots of Colo... But right now is one of those times, in part due to the big warm up mid last week followed by heavy snow on top...

March 22, 2023 Avi danger
View attachment 34964

I thought that triangle was permanent over SW San Juans...till maybe March.
 
"this season has now etched its way into the history books as the second snowiest in the 77 years of record-keeping at the Central Sierra Snow Lab — more than 56.4 feet with no end in sight.
https://www.tahoedailytribune.com/news/no-telling-how-much-more-snow-coming-for-sierra-nevada/
And there’s still a chance it could surpass the record of 67.7 feet set in 1951-52 when more than 200 passengers on a San Francisco-bound luxury train from Chicago were stranded for three days near Donner Pass west of Truckee."

Also includes list of top 10 snowiest winters:

"TOP 10 HISTORIC SIERRA SNOW SEASONS

1951-52 — 812 inches or 67.7 feet

2022-23 — 677 inches or 56.4 feet

1982-83 — 671 inches or 55.9 feet

2010-11 — 643 inches or 53.6 feet

1981-82 — 624 inches or 52 feet

1968-69 — 602 inches or 50.2 feet

1994-95 — 598 inches or 49.8 feet

1955-56 — 594 inches or 49.5 feet

1957-58 — 593 inches or 49.4 feet

2016-17 — 573 inches or 47.7 feet

Source: UC-Berkeley Central Sierra Snow Lab; Soda Springs; founded 1946. The snow season coincides with the water season that begins on Oct. 1 and runs through the following Sept. 30."
 
I thought that triangle was permanent over SW San Juans...till maybe March.
Not really. Colorado, including the San Juans, spends a huge % of the season at Considerable (stage 3), but not a lot of time at High 4 or Extreme 5.


tseeb, for the Sierras I note two unusual items in this years current 2nd place (though non-'official' old RR records indicate multiple years of snowfall similar to or potentially more than the 1951-52 record year). One is that many storms have been colder than typical(note 1), so much more snowfall at lake level in Tahoe/Mammoth town to be dealt with for example. Also, that it has been mostly very consistent - eg every month is a huge snow month, not a ton of long gaps between storms which a bit unusual for the Sierra, IMO.

Finally, If I recall, some of the big snows in official record years had much of it in late March-early May... Which means that earlier in the season snowfalls were already melting prior and the big new late season snowfalls also melted out (at least partially) much quicker leaving much less human impact on roads, structures, shoveling, etc... than this year has provided.

Note 1: I find it hilarious when various YouTube video creators dealing with the snow in the Sierra start off by talking about how "cold it is this morning" then reference temps that are only in the mid-teens. Such a banana belt of skiing, lol.
 
Mammoth is about to break its Main Lodge record maybe today/tomorrow.

Palisades has good info for March-May snowfall:

1679526721963.png


Mammoth even better:

SeasonTOTALPRE-OCTOCTNOVDECJANFEBMARAPRMAYJUNJUL
2022-236640061116220113154
2021-222600329161071434300
2020-21244.5002133108.522535200
2019-202810054711308357300
2018-194920055269320768113200
2017-1826241343362814210400
2016-17617.50101975245.51633067710
2015-16362.20056711102085163.210
2014-151760013.163.52.6337.528.32800
2013-1423801010.524.51568.556.547600
2012-13308.301860.7147.1261029143.500
2011-12263019.53025634.57942000
2010-11668.5010882092992177.53127.54.50
2009-10557.90342110312710862.584.917.500
2008-947001026.5120.56314462.53011.520
2007-8333.51014.565.5126.58916.52.51800
2006-7222.1045.556.611100.51326.5500
2005-6578.50023.4107.8112.448.1164.1118.44.300
2004-5570.1085.628.3109.312772.985.635.525.10.80
2003-4348.96023124.951.6108.620.913.70.200
2002-33563025134.48.633.930.39624.800
2001-2299.60643.897.137.428.145.525.915.800
2000-1393.903822.8968.8124.160.370.9000
1999-0382.70021.53.1121.4136.148.6411100
1998-99332.45040.53778.573.842.555.1000
1997-98451.41036.541.798.2159.358.7352100
1996-97323.8525.533.4130.2121.66.50.11.5000
1995-96321.200052.776.6106.441.740.13.700
1994-95540.20087.353.718217.7139.73425.800
1993-94275.10019.227.227.8118.425.339.417.800
1992-93472.5023.50.5102.1161.5134.538.311.90.200
1991-9222617024.245.116.794.9244.1000
1990-91242006.827.811.46.31765.97.800
1989-90214.301617.9262.571.82317.1400
1988-89251.40034.274.710.235.86712.716.800
1987-88230002766.176.79.311.133.16.700
1986-87195.8500054.769.9588.2000
1985-86433.60094.245.135.8168.869.415.3500
1984-85236.86051.543.125.64565.60000
1983-84273.319060.4101.67.332.221.828.42.600
1982-83546.313042105.5118.597.7112.3525.300
1981-82502.5009429.5130.528.513974.56.500
1980-812304001971.517.59815500
1979-80444.5230056100133.566.53826.510
1978-79386.56029.551.5102.5967811.511.500
1977-78487.560269895.59785.578.5100
1976-779440002627370000
1975-76197.5270014.513.5545038.5000
1974-75378.51501358.5261019075000
1973-74306.545004587.598238000
1972-73370.54057.164.584.91034310400
1971-72268.52209139.832.211153.5000
1970-71255.560001092919.52414000
1969-70244.52200417830.54627000

Sorted by Total
SeasonTOTALPRE-OCTOCTNOVDECJANFEBMARAPRMAYJUNJUL
2010-11668.5010882092992177.53127.54.50
2022-236640061116220113154
2016-17617.50101975245.51633067710
2005-6578.50023.4107.8112.448.1164.1118.44.300
2004-5570.1085.628.3109.312772.985.635.525.10.80
2009-10557.90342110312710862.584.917.500
1982-83546.313042105.5118.597.7112.3525.300
1994-95540.20087.353.718217.7139.73425.800
1981-82502.5009429.5130.528.513974.56.500
2018-194920055269320768113200
1977-78487.560269895.59785.578.5100
1992-93472.5023.50.5102.1161.5134.538.311.90.200
2008-947001026.5120.56314462.53011.520
1997-98451.41036.541.798.2159.358.7352100
1979-80444.5230056100133.566.53826.510
1985-86433.60094.245.135.8168.869.415.3500
2000-1393.903822.8968.8124.160.370.9000
1978-79386.56029.551.5102.5967811.511.500
1999-0382.70021.53.1121.4136.148.6411100
1974-75378.51501358.5261019075000
1972-73370.54057.164.584.91034310400
2015-16362.20056711102085163.210
2002-33563025134.48.633.930.39624.800
2003-4348.96023124.951.6108.620.913.70.200
2007-8333.51014.565.5126.58916.52.51800
1998-99332.45040.53778.573.842.555.1000
1996-97323.8525.533.4130.2121.66.50.11.5000
1995-96321.200052.776.6106.441.740.13.700
2012-13308.301860.7147.1261029143.500
1973-74306.545004587.598238000
2001-2299.60643.897.137.428.145.525.915.800
2019-202810054711308357300
1993-94275.10019.227.227.8118.425.339.417.800
1983-84273.319060.4101.67.332.221.828.42.600
1971-72268.52209139.832.211153.5000
2011-12263019.53025634.57942000
2017-1826241343362814210400
2021-222600329161071434300
1970-71255.560001092919.52414000
1988-89251.40034.274.710.235.86712.716.800
1969-70244.52200417830.54627000
2020-21244.5002133108.522535200
1990-91242006.827.811.46.31765.97.800
2013-1423801010.524.51568.556.547600
1984-85236.86051.543.125.64565.60000
1987-88230002766.176.79.311.133.16.700
1980-812304001971.517.59815500
1991-9222617024.245.116.794.9244.1000
2006-7222.1045.556.611100.51326.5500
1989-90214.301617.9262.571.82317.1400
1975-76197.5270014.513.5545038.5000
1986-87195.8500054.769.9588.2000
2014-151760013.163.52.6337.528.32800
1976-779440002627370000
 
Back
Top